ECE 5554 / ECE 4554: Computer Vision Fall 2017
Instructions
Due date: 11:59pm on Wed, October 25th, 2017
Handin: through https:canvas.vt.edu
Starter code and data: hw3.zip
Deliverables:
Please prepare your answer sheet using the filename of FirstName_LastName_HW3.pdf.
Include all the code you implement in each problem. Remember to set relative paths so that we can run your code out of the box.
Compress the code and answer sheet into FirstName_LastName_HW3.zip before uploading it to canvas.
Part 1: Epipolar Geometry (50 points)
 |
Overview
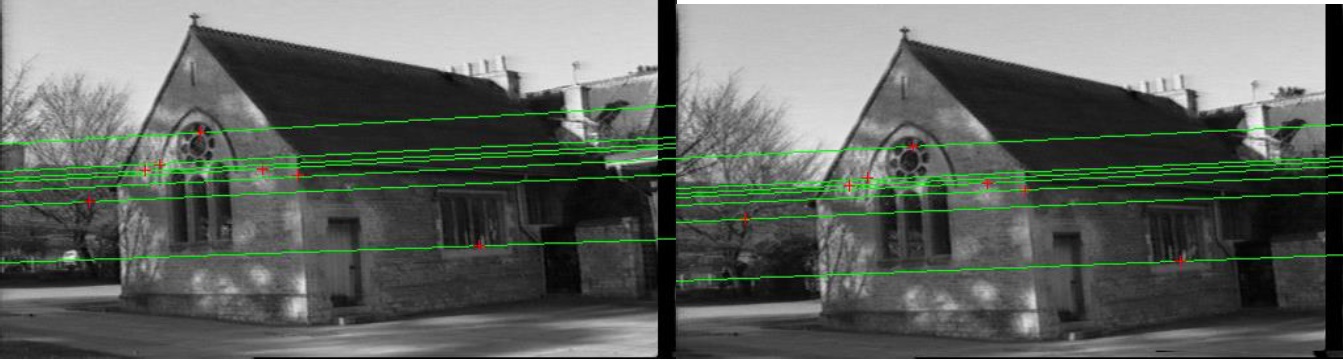
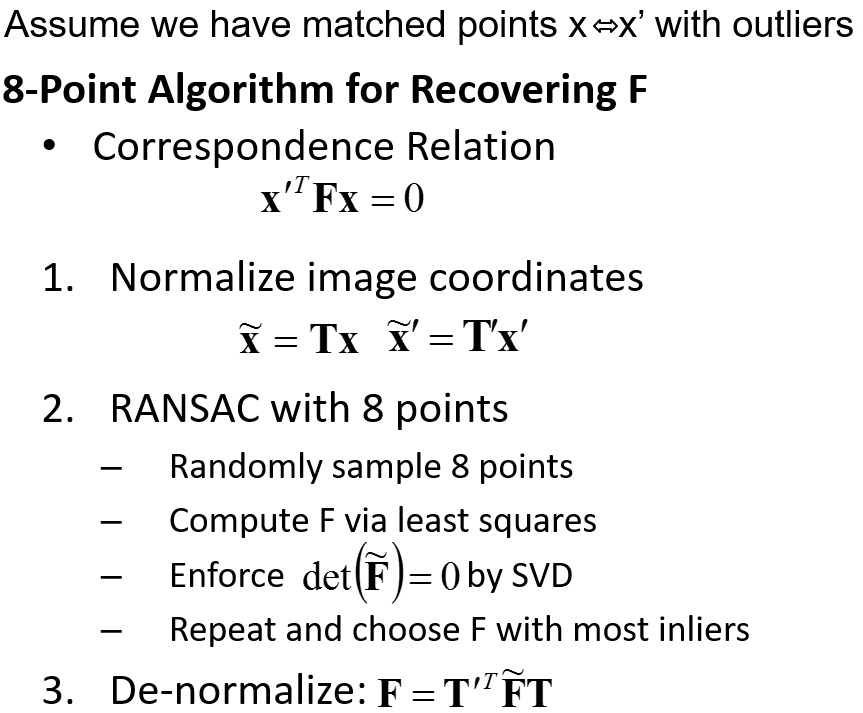
In this problem, you will implement an algorithm for automatically estimating the fundamental matrix F using RANSAC and the normalized 8-point algorithm. In the file matches.mat, we provide the detected Harris corners row-column positions in variables r1 c1 for the first image; variables r2 c2 for the second image; and the corresponding matched pairs in the variable matches.
The outline of the normalized 8-point algorithm:
 |
Write-up
Describe what test you used for deciding inlier vs. outlier.
Display the estimated fundamental matrix F after normalizing to unit length
Plot the outlier keypoints with green dots on top of the first image plot(x, y, '.g');
Randomly select 7 sets of matching points. Plot the corresponding epipolar lines ('g’) and the points (with 'r+’) on each image. Show the two images (with plotted points and lines) next to each other.
Hint
The provided function plotmatches.m (e.g. plotmatches(im1,im2,[c1 r1]’,[c2 r2]’,matches’)) can be used to plot matches for debugging.
We suggest that you manually select a set of good matches and getting it working with those matches first. Then, you can get it working using RANSAC. If you get it working with manual selection but not with RANSAC, you will get half credit.
Your epipolar lines should pass very near (e.g., within 1 pixel) your plotted points.
Do not use MATLAB computer vision toolbox for RANSAC or for estimating the fundamental matrix.
Useful functions
randsample(): for randomly picking integers from a range. Useful for RANSAC.
Rubric
10 points for describing the test used for deciding inlier vs. outlier
10 points for plotting the inliers and outliers on top of the first image
15 points for reporting the estimated fundamental matrix
15 points for displaying the epipolar lines and matched points.
Part 2: Affine Structure from Motion (50 points)
 |
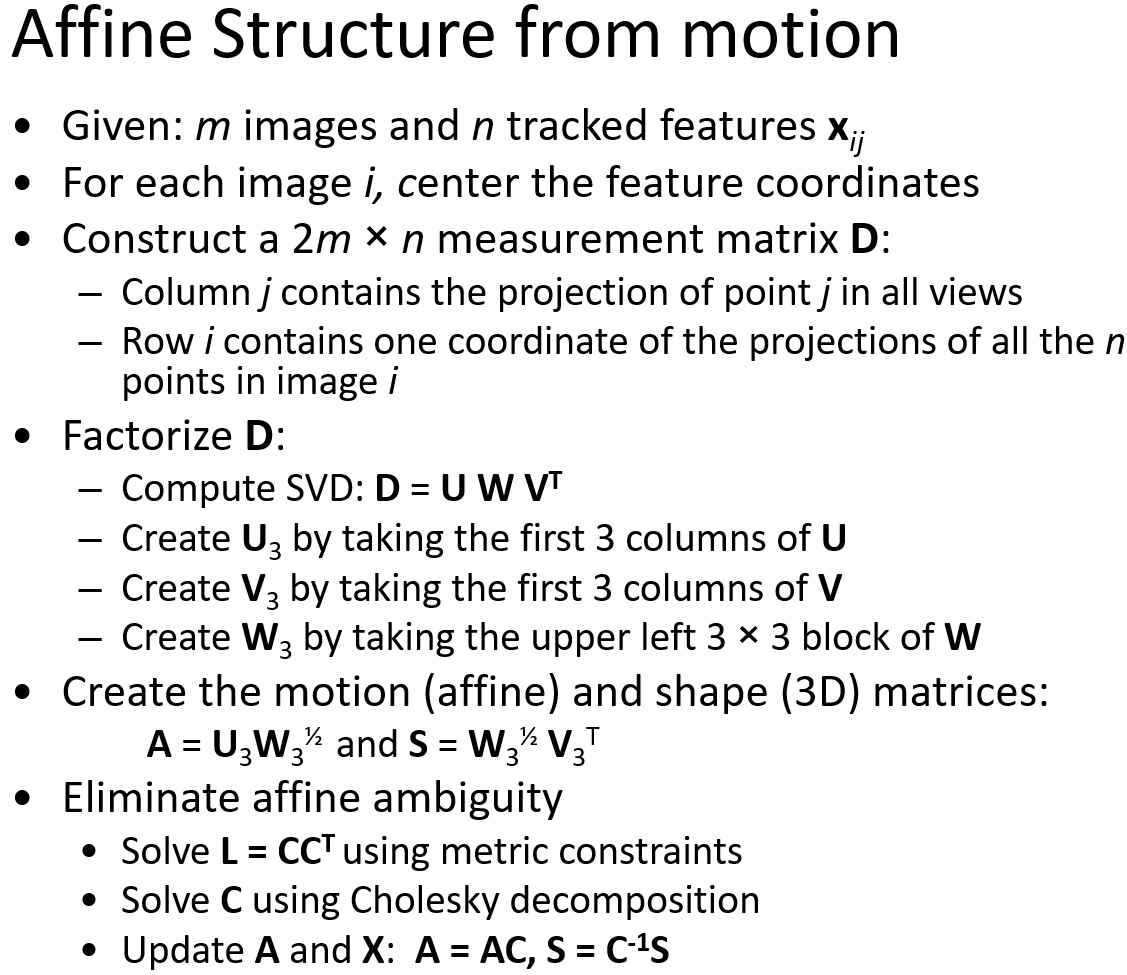
This problem continues the interest point detection and tracking problem from HW2. Now, you will recover a 3D pointcloud from the image sequence hotel.seq0.png … hotel.seq50.png. You are encouraged to use your results from HW2, but in case you were not able to complete it, we have also included pre- computed intermediate results in the supplemental material. Submit your code so that we can reproduce your results.
The outline of the affine structure from motion algorithm:
 |
Write-up
Include pseudocode in your report.
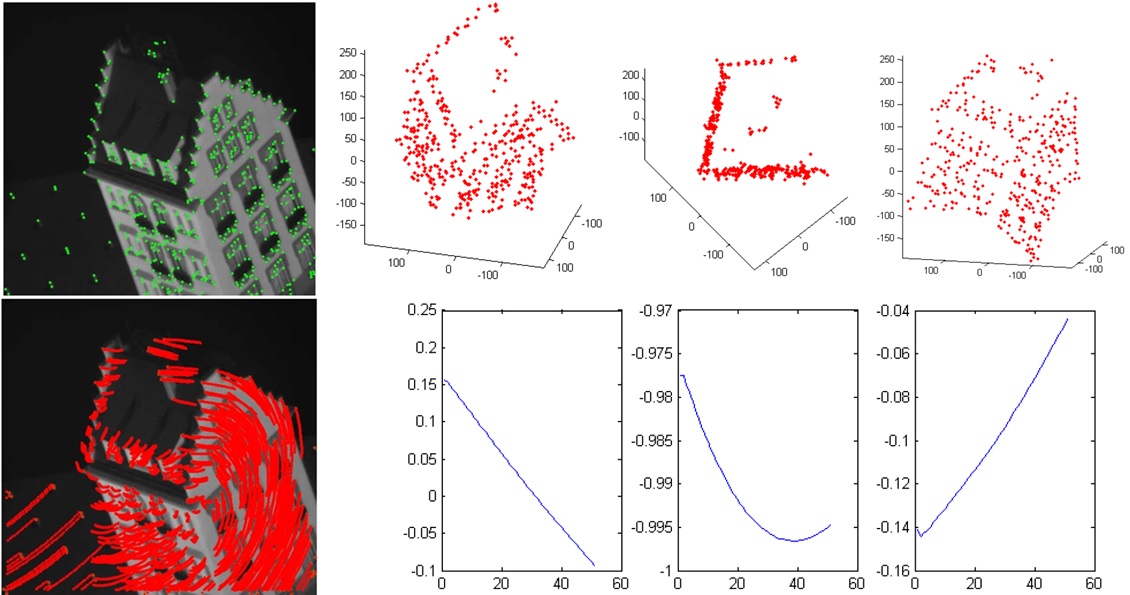
Plot the predicted 3D locations of the tracked points for 3 different viewpoints. Choose the viewpoints so that the 3D structure is clearly visible.
Plot the predicted 3D path of the cameras. The camera position for each frame is given by the cross product a_k = a_i x a_j. Normalize a_k to be unit length for consistent results. Give 3 plots, one for each dimension of a_k We provide the function plotSfM.m for visualizing the recovered 3D shape and camera positions in each frame.
Hint
Do not use existing structure from motion code, such as found in OpenCV.
The provided file tracks.mat contains the tracked keypoints over 51 frames.
Useful functions
svd: for computing singular value decomposition
chol: for computing Cholesky factorization
plot3: for displaying 3D points
Reference:
Tomasi and Kanade. Shape and Motion from Image Streams under Orthography: a Factorization Method. 1992
Rubric
5 points for the pseudocode
25 points for the correct implementation of affine structure from motion
10 points for displaying the recovered 3D shapes under 3 different viewpoints.
10 points for displaying the recovered camera motion.
Graduate credit (max possible 40 points extra credit)
Single-view metrology
 |
up to 10 points: Estimate the horizon and draw/plot it on the image. Assume that the sign is 1.65 meter. Estimate the heights of the tractor, the building, and the camera (in meters). This can be done with powerpoint, paper and a ruler, or Matlab.
Turn in an illustration that shows the horizon line, and the lines and measurements used to estimate the heights of the building, tractor, and camera.
Report the estimated heights of the building, tractor, and camera in meters.
Automatic vanishing point detection
up to 20 points: Use RANSAC to automatically detect three orthogonal vanishing points.
[VP, lineLabel] = vpDetectionFromLines(lines);
This function takes a set of line segments and uses RANSAC to detect three vanishing points that correspond to three orthogonal directions in the scene. The main steps are
(1) randomly select a set of edge pairs, compute their intersections as vanishing points hypothesis;
(2) check the consistency of these vanishing points hypothesis;
(3) clustering the line segments into different groups corresponding to vanishing points.
For (3), you may use the clustering code we included.
lineLabel = clusterLineSeg(PrefMat);
This function takes a binary matrix PrefMat of size [NumLines x NumVP] where PrefMat(i, j) = 1 indicates line segment i is compatible with vanishing point j (i.e., i-th line is an inlier of j-th vp).
Input:
lines: a matrix of size [NumLines x 5] where each row represents a line segment with (x1, y1, x2, y2, lineLength)
Output:
VP: [2 x 3] each column corresponds to a vanishing point in the order of X, Y, Z
lineLabel: [NumLine x 3] each column is a logical vector indicating which line segments correspond to the vanishing point.
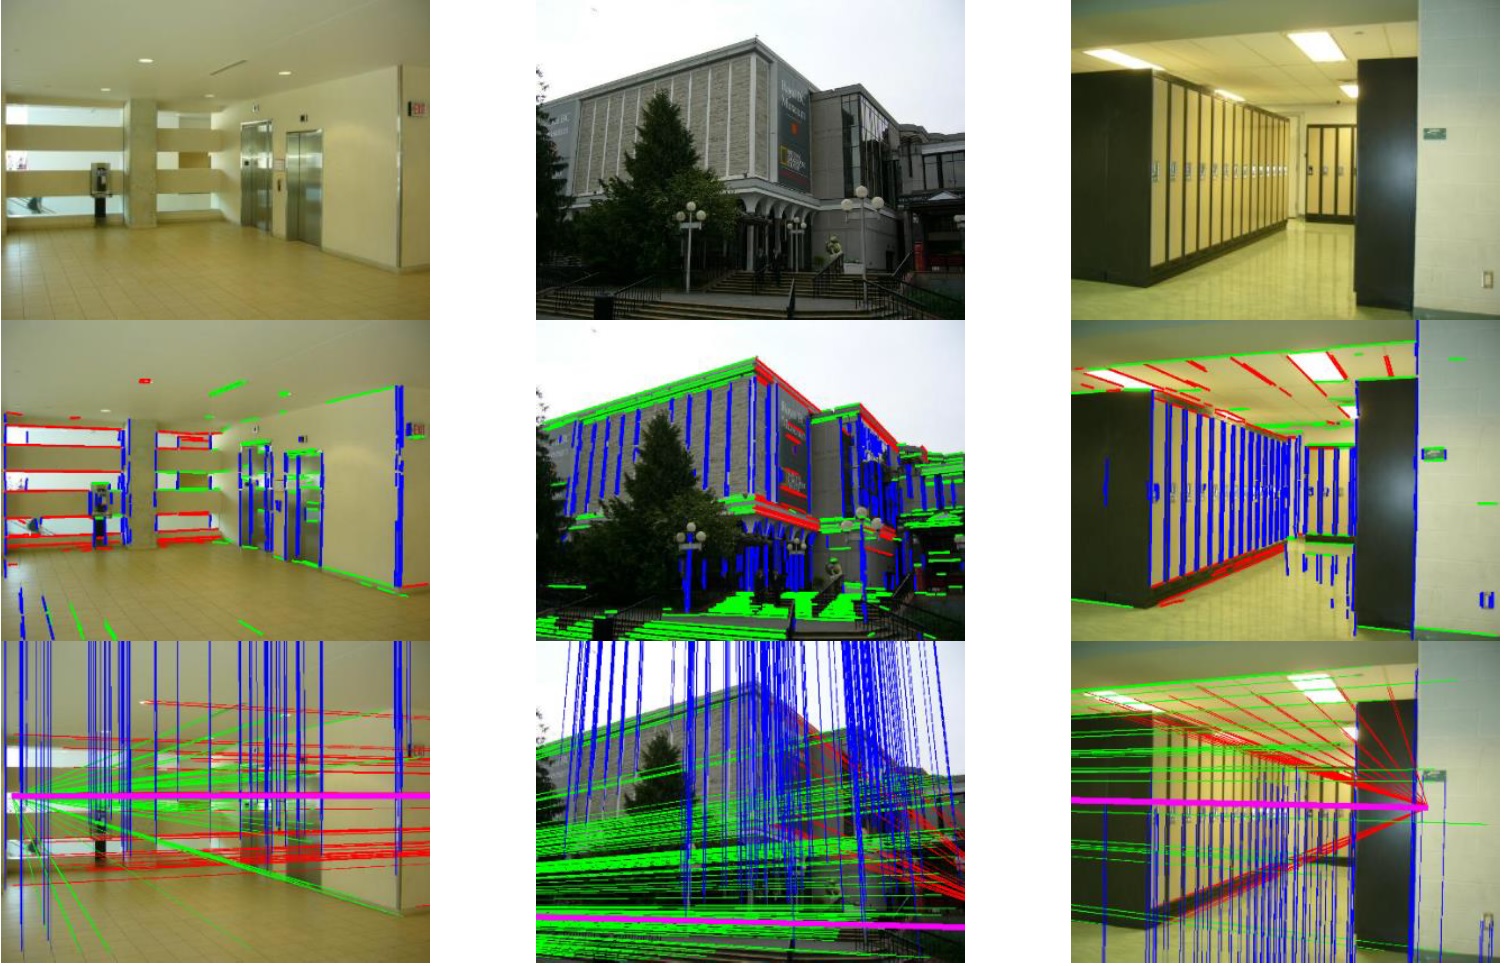
Your algorithm should be able to get results similar to the following. First row, original image. Second row, the line segments grouped into three orthogonal vanishing points. Third row, the vanishing points and the position of the ground plane.
 |
Write-up
Show three results where you can automatically detect three vanishing points.
Epipolar Geometry
up to 10 points: compare the results with un-normalized 8-point algorithm with RANSAC. For the inlier matches, report the averaged value of (x’^T F x)^2 (i.e. evaluating how well the recovered fundamental matrix F explains the inlier matches). Compare this value with the normalized 8-point algorithm.
Affine structure from motion
up to 20 points: Missing track completion. Some keypoints will fall out of frame, or come into frame throughout the sequence. Use the matrix factorization to fill in the missing data and visualize the predicted positions of points that aren't visible in a particular frame.
In your answer sheet, describe the extra points under a separate heading.
Acknowledgements
This homework is adapted from the projects developed by Derek Hoiem (UIUC)