Tree-Augmented Naive Bayes Cassification of Various Attributes of States Using National Flags
Igor JanjicSpring 2014 ECE 6504 Probabilistic Graphical Models: Class Project
Virginia Tech
Goal
The goal of the project was to see if various properties of states could be classified by using only the geometry, colors, and icons on various state flags. The dataset that was used comes from "Collins Gem Guide to Flags" from Collins Publishers (1986). The dataset has 23 categorical features, 194 instances of different countries, and 6 different classification variables. The classification variables are not related to the geometry of the flag but describe the country the flag represents.Classification Variables
1. Landmass: Which continent the country is on (1 = North America, 2 = Soputh America, 3 = Europe, 4 = Africa, 4 = Asia, 6 = Oceania).
2. Zone: Which quadrant the country is on which is based on Greenwich and the Equator (1 = NE, 2 = SE, 3 = SW, 4 = NW).
3. Area: The size of the country in thousands of square km. This was descritized to fall in a logarithmic range 1 - 5.
4. Population: Size of the country in round millions> This was descritized to fall in a logarithmic range 1 - 5.
5. Language: The most popular language spoken in the country (1 = English, 2 = Spanish, 3 = French, 4 = German, 5 = Slavic, 6 = Other Indo-European, 7 = Chinese, 8 = Arabic, 9 = Japanese/Turkish/Finnish/Magyar, 10 = Others).
6. Religion: The most popular religion practiced in the country (0 = Catholic, 1 = Other Christian, 2 = Muslim, 3 = Buddhist, 4 = Hindu, 5 = Ethnic, 6 = Marxist, 7 = Others).
Features
1. Bars: The number of vertical bars in the flag.
2. Stripes: The number of horizontal stripes in the flag.
3. Colours: The number of different colors in the flag.
4. Red: Binary feature which is 0 if red is absent and 1 if red present in the flag.
5. Green: Binary feature which is 0 if green is absent and 1 if red present in the flag.
6. Blue: Binary feature which is 0 if blue is absent and 1 if red present in the flag.
7. Gold: Binary feature which is 0 if gold is absent and 1 if red present in the flag.
8. White: Binary feature which is 0 if white is absent and 1 if red present in the flag.
9. Black: Binary feature which is 0 if black is absent and 1 if red present in the flag.
10. Orange: Binary feature which is 0 if orange is absent and 1 if red present in the flag.
11. Mainhue: The predominant colour in the flag (tie-breaks decided by taking the topmost hue, if that fails then the most central hue, and if that fails the leftmost hue).
12. Circles: Number of circles in the flag.
13. Crosses: Number of upright crosses.
14. Saltires: Number of diagonal crosses.
15. Quarters: Number of quartered sections.
16. Sunstars: Number of sun or star symbols.
17. Crescent: Binary feature which is 1 if a crescent moon symbol is present and 0 if it is absent.
18. Triangle: Binary feature which is 1 if any triangles are present and 0 otherwise.
19. Icon: Binary feature which is 1 if an inanimate image present (e.g., a boat), otherwise it is 0.
20. Animate: Binary feature which is 1 if an animate image (e.g., an eagle, a tree, a human hand) is present and 0 otherwise.
21. Text: Binary feature which is 1 if any letters or writing are on the flag (e.g., a motto or slogan) and 0 otherwise
22. Topleft: The most predominant color in the top-left corner (moving right to decide tie-breaks).
23. Botright: The most predominant color in the bottom-left corner (moving left to decide tie-breaks).
Dataset Citation: Citation: Bache, K. & Lichman, M. (2013). UCI Machine Learning Repository [http://archive.ics.uci.edu/ml]. Irvine, CA: University of California, School of Information and Computer Science.
Approach
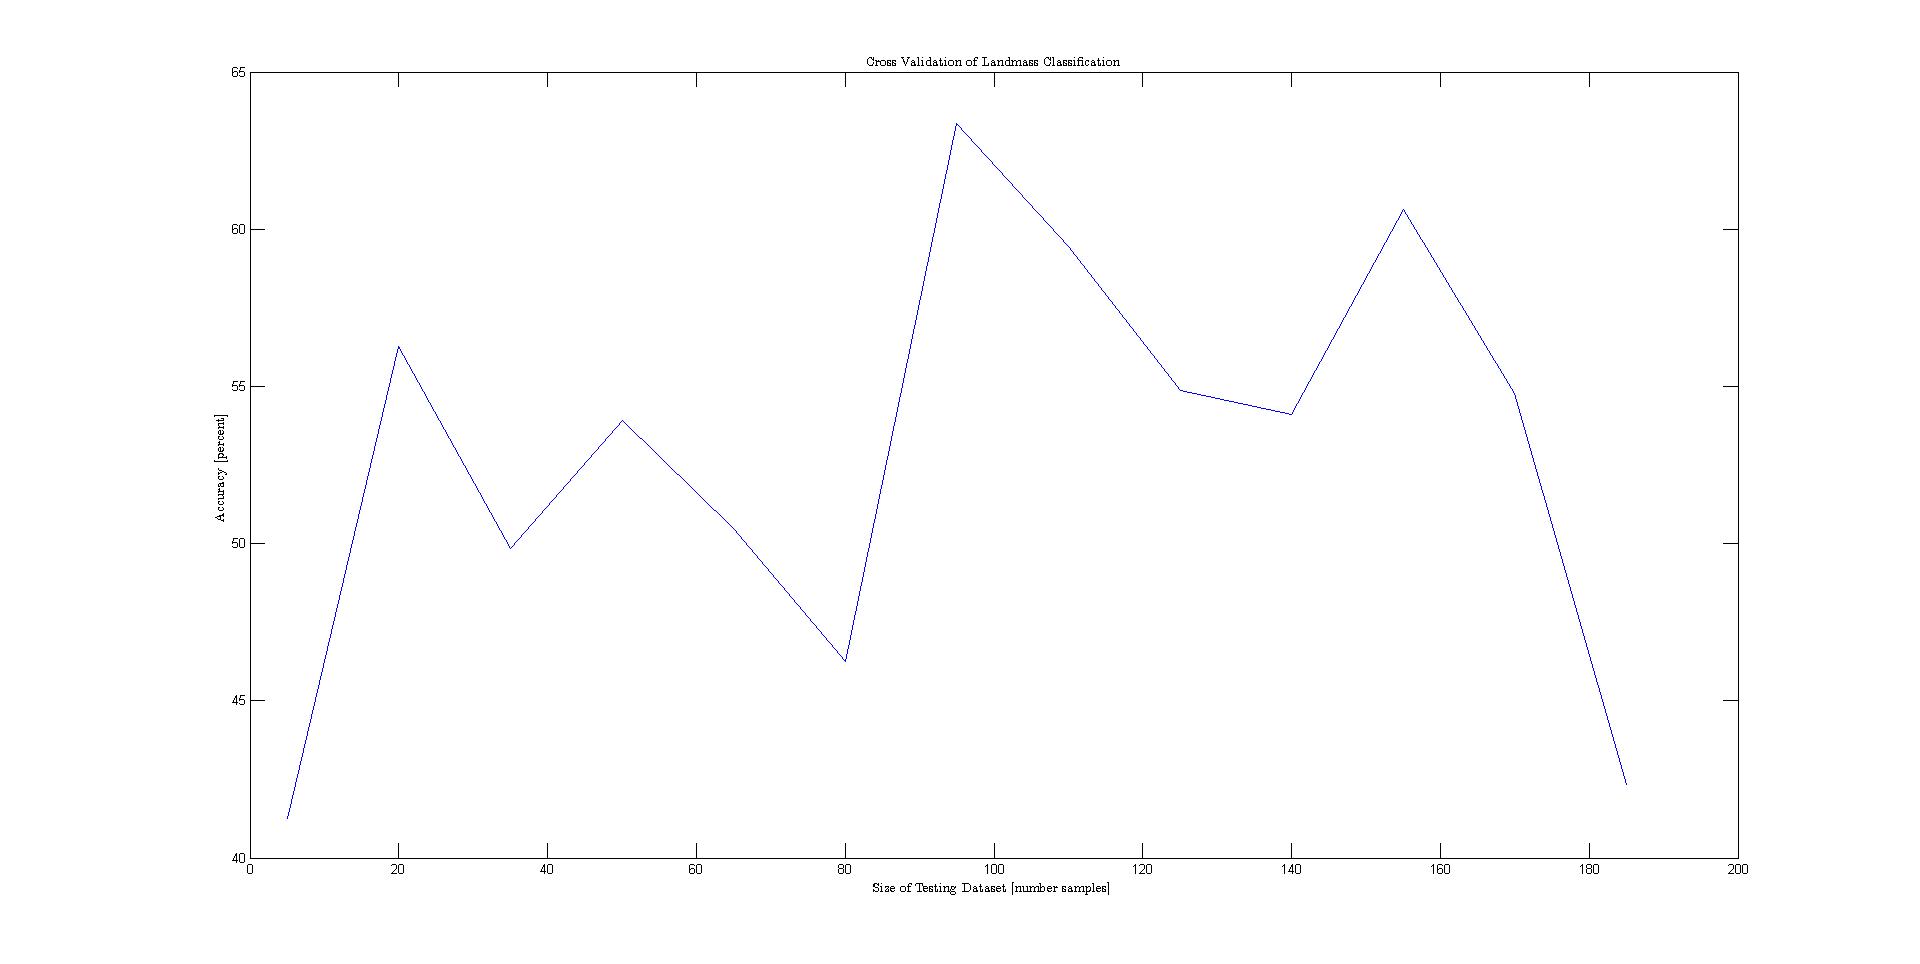
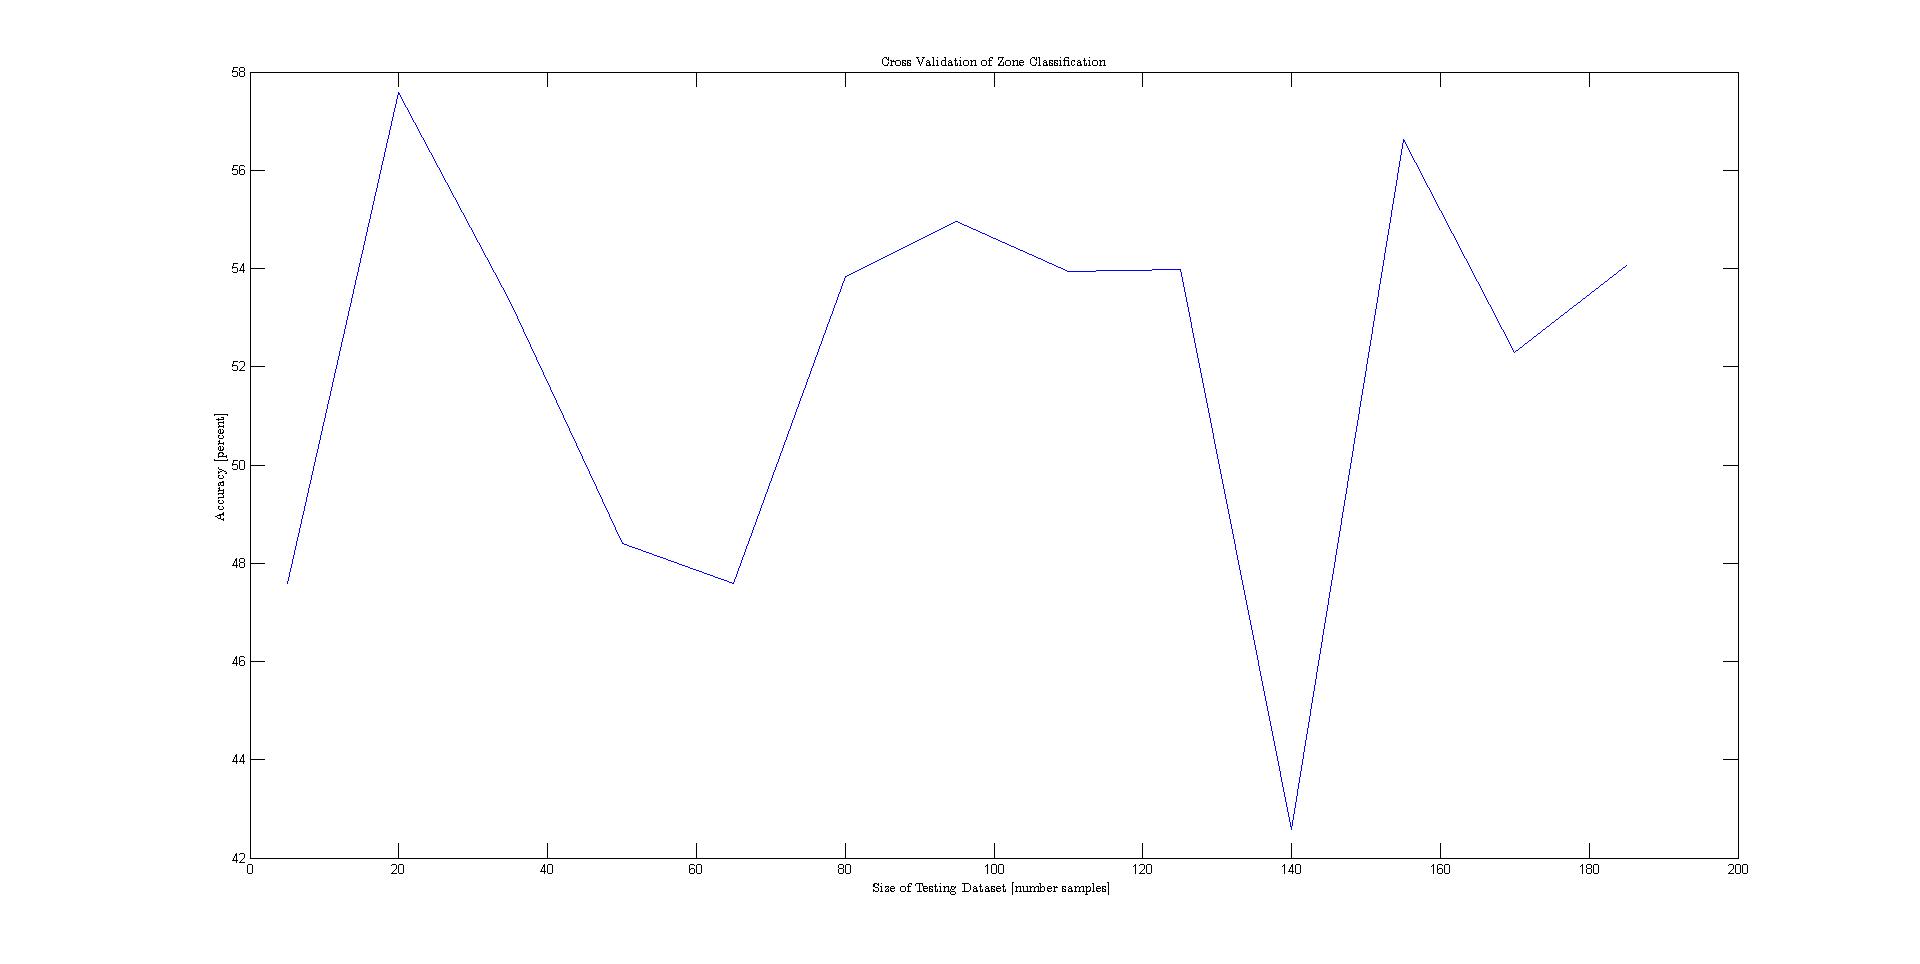
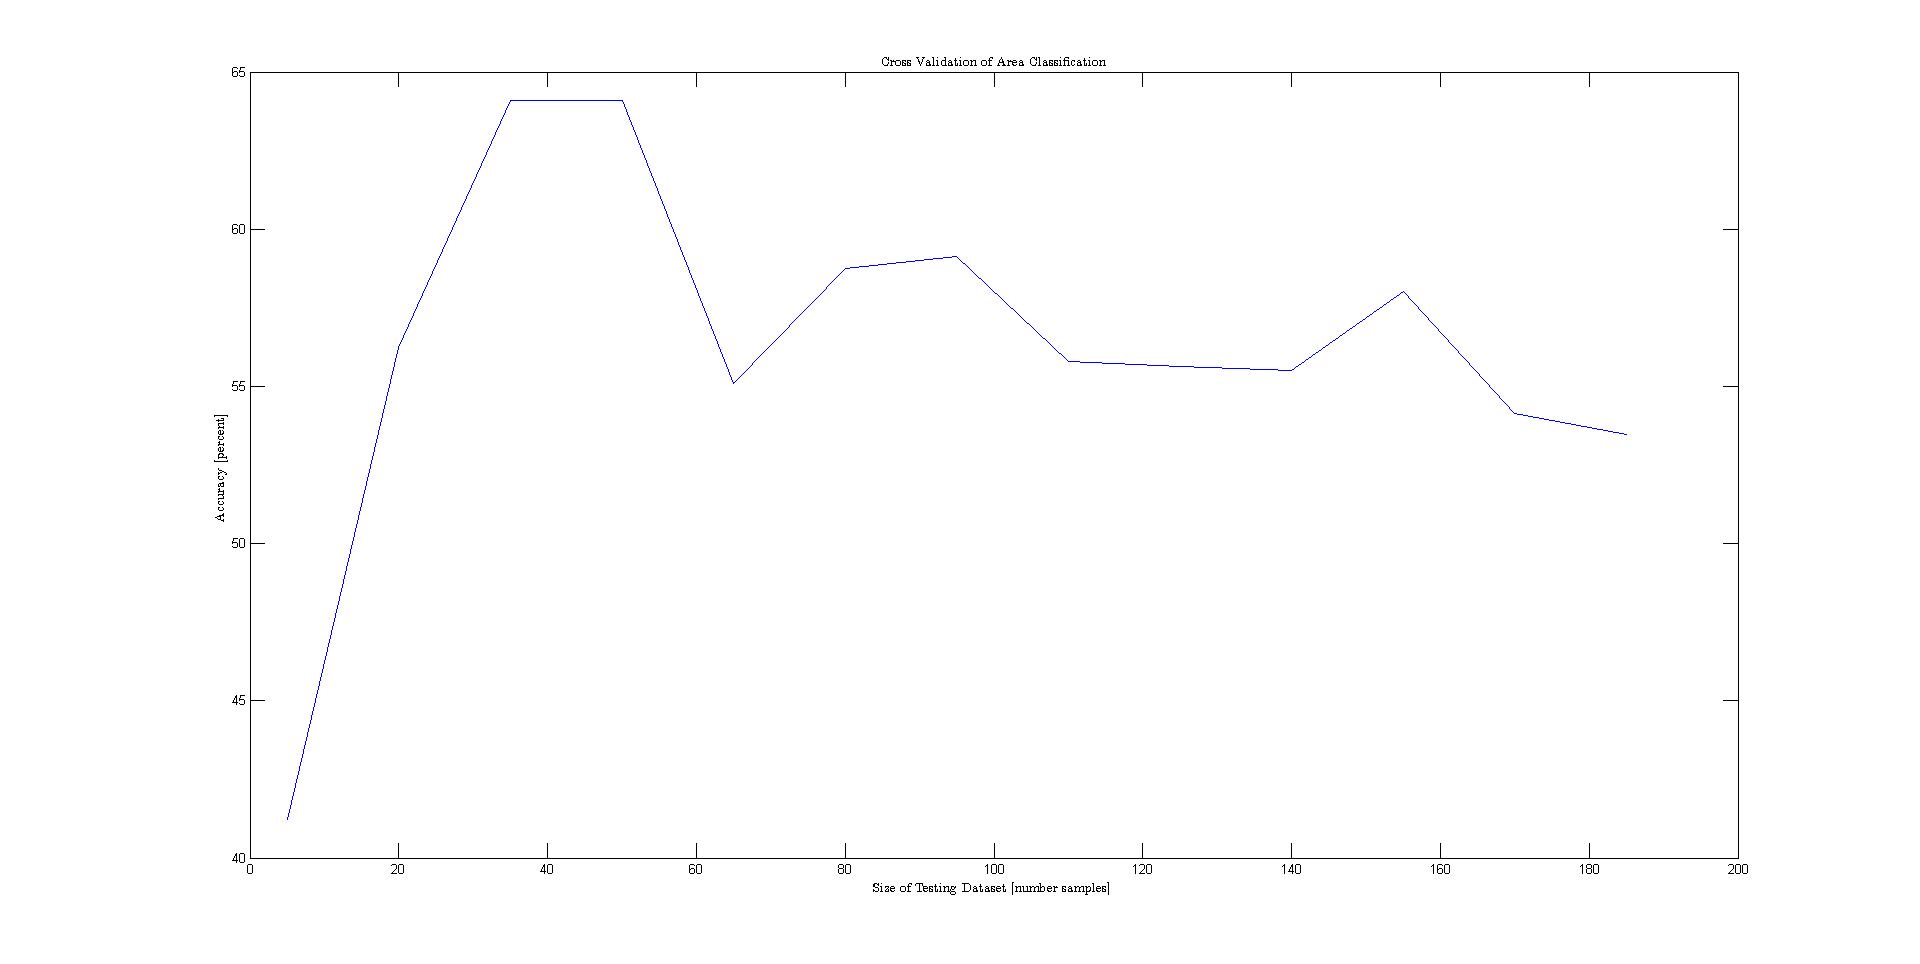
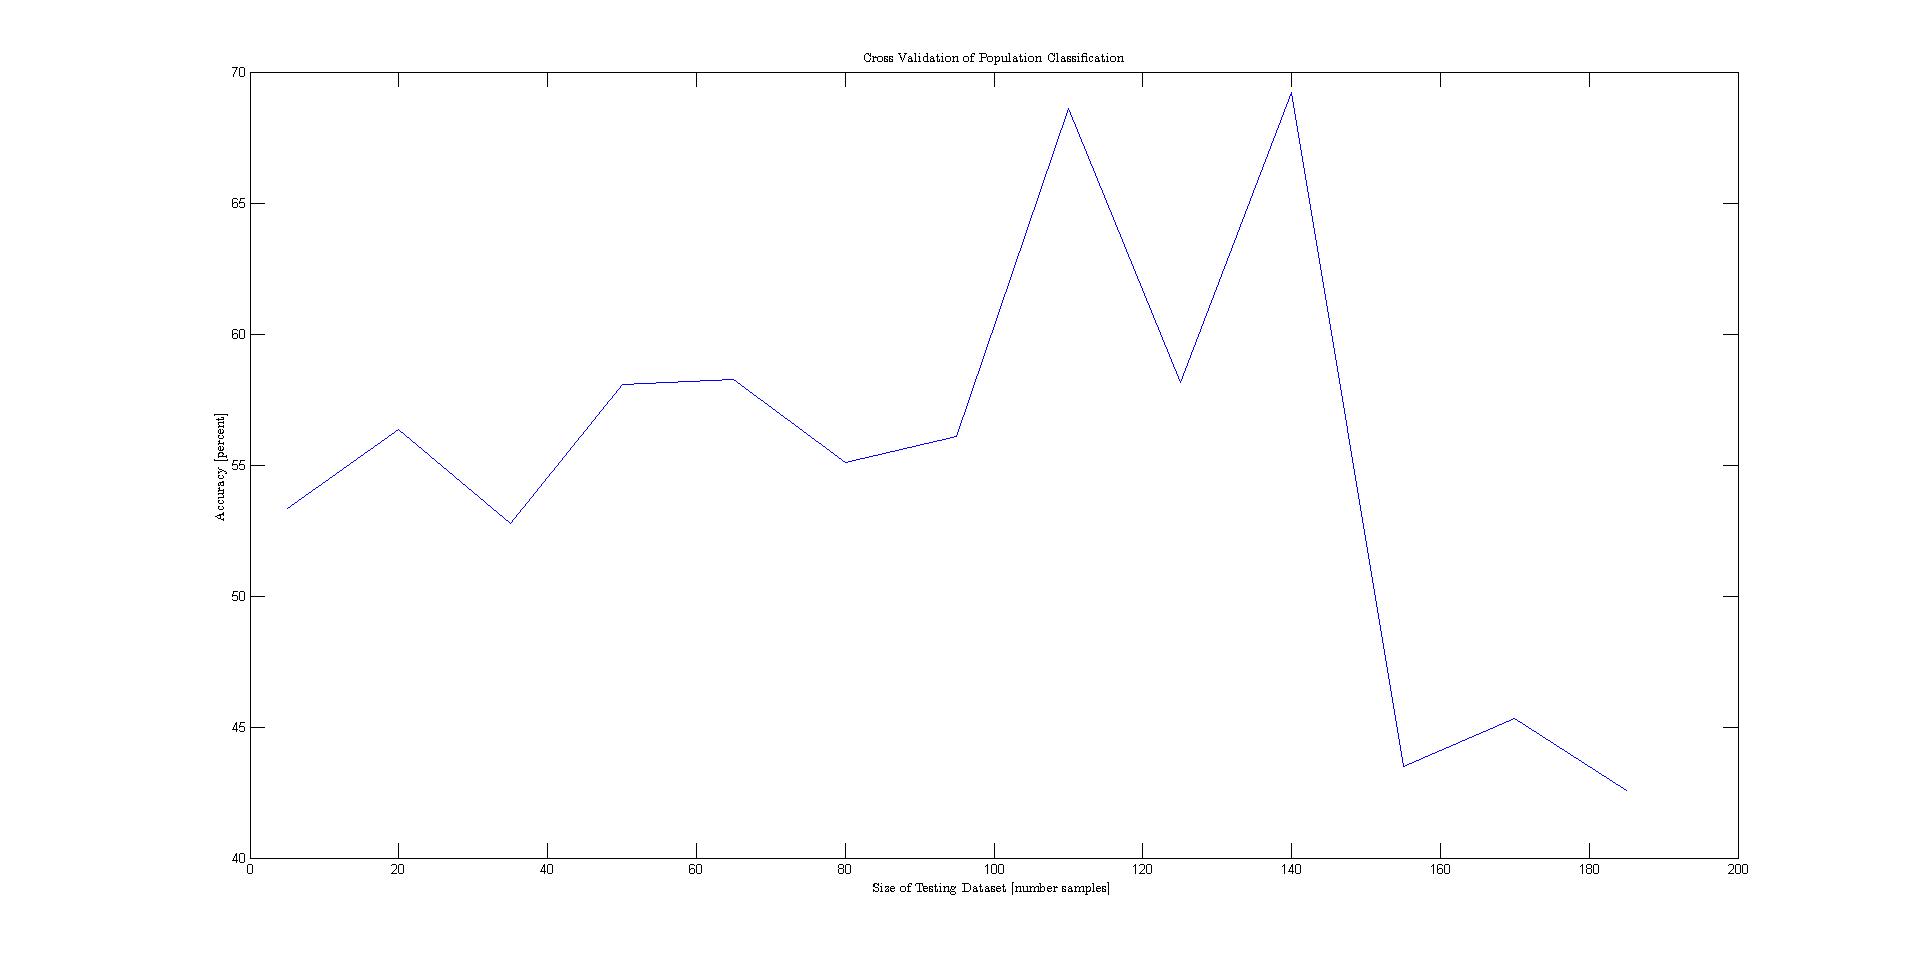
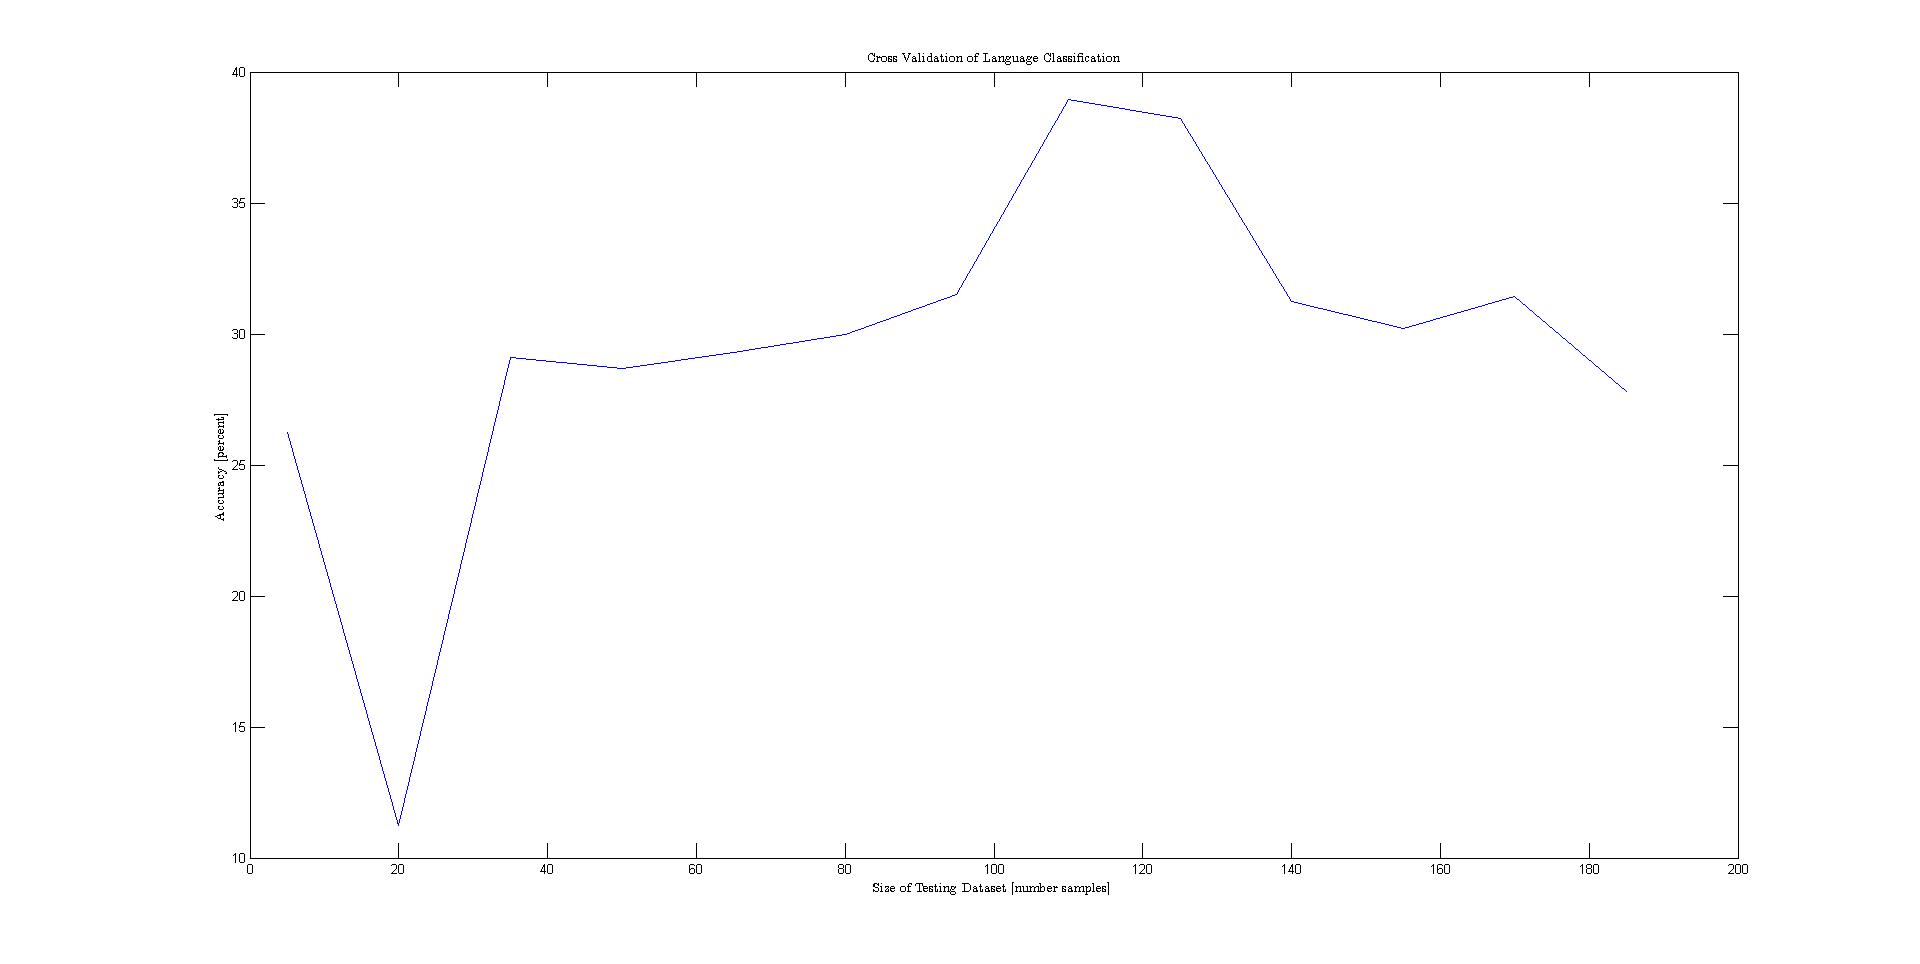
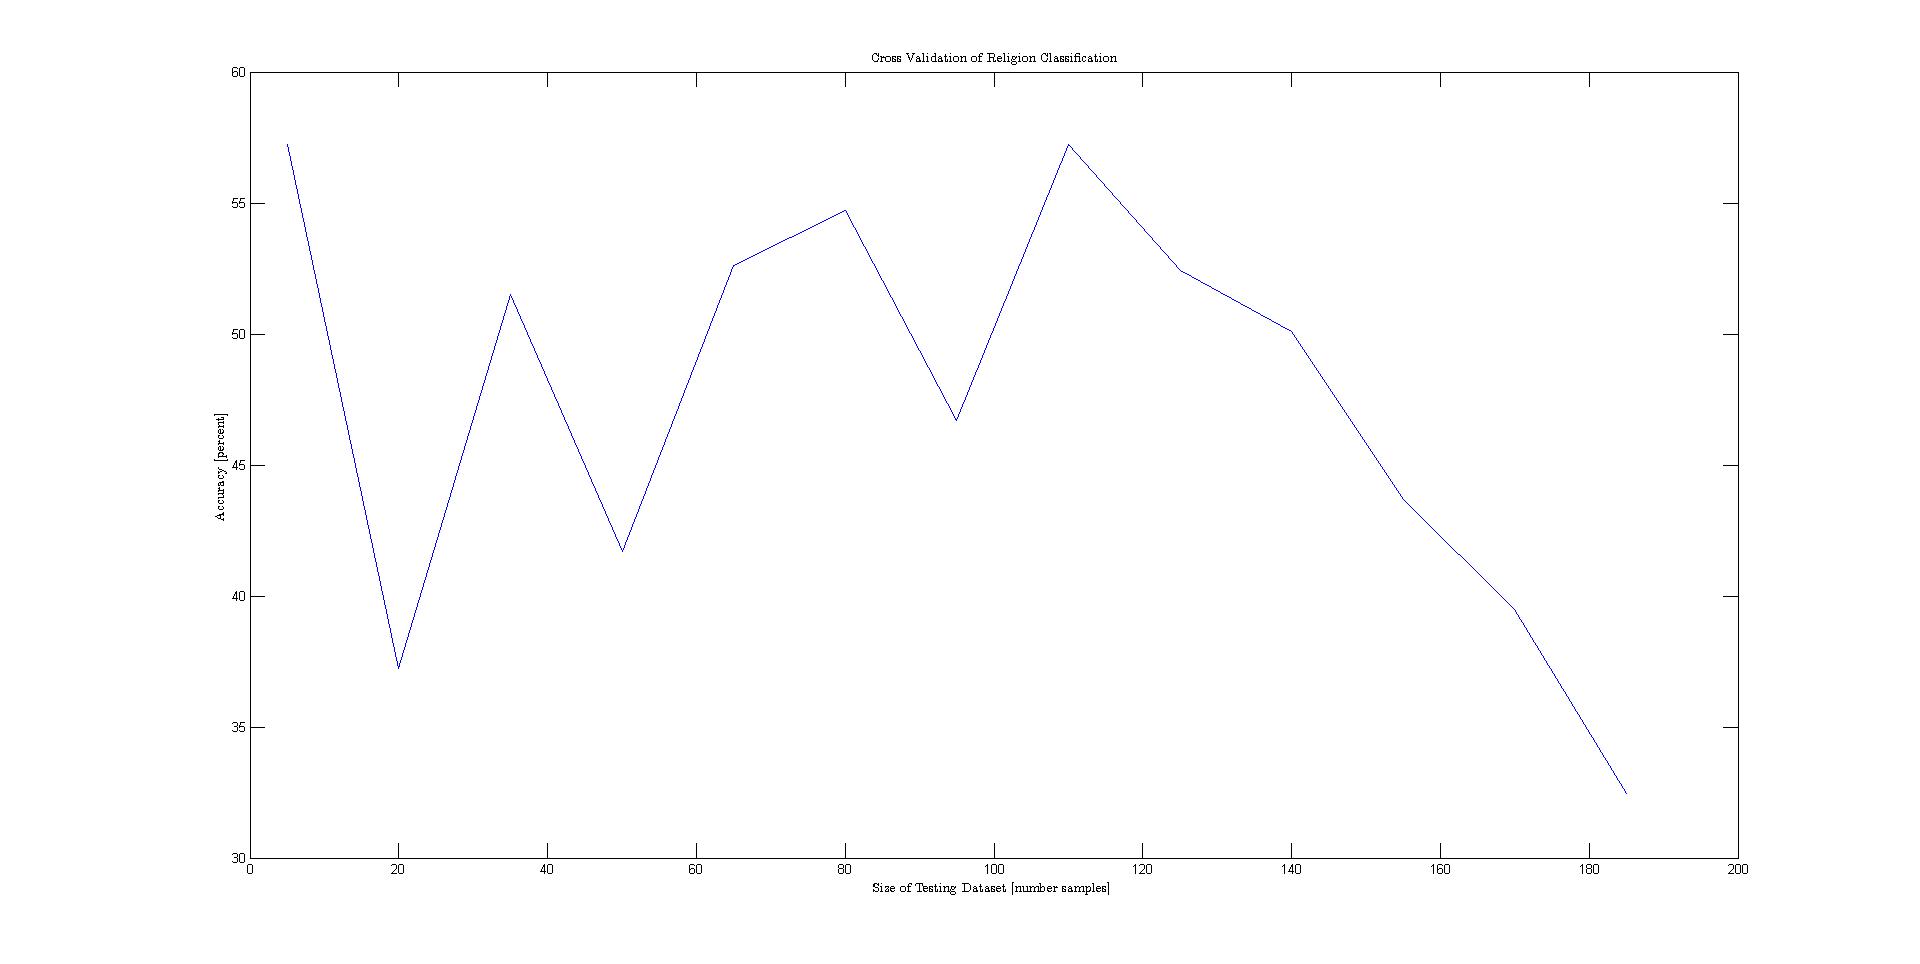
The problem statement can be formalized as follows: given various features of a nation's flag, classify various attributes of the represented state. A Tree-Augmented Naive Bayes network was used to model the conditional independencies between the different features. The TAN model was opted for because of it's simplicity and strong classification accuracy. However, before the dataset could be used in the model, the continuously represented variables area and population needed to be changed to descrete values on a logarithmic scale to preserve the differences between the large number of small states. In addition, a number of features that described colors were given as strings. These were also descretized. Before the data was plotted, it was permuted and separated into training and testing. Then cross validation was performed to generate the plots below.Results
The plot below shows the results for each cross validation. The best performing class variables were landmass, area, and language.