Health Condition Classification of Pigs Livers Based on Expert
Scores Using Bayesian Network
Tingting
Huang
Spring
2014 ECE 6504 Probabilistic Graphical Models: Class Project
Virginia Tech
Objective
The
objective of this project is to apply Bayesian network approaches for
classification in biomedical area. Naïve Bayesian (NB), Tree Augmented Naïve
Bayesian (TAN) and Forest Augmented Naïve Bayesian (FAN) are used, and the
correctness of these approaches is compared through confusion matrices and
penalty values.
Problem description
In
biomedical area, Hematoxylin and Eosin (H&E)
stain slides of a sample can reflect the health condition of the corresponding liver
where the sample is cut from. In this project, 100 samples were cut from a pig
liver under different health conditions, and were made to H&E stain slides.
One H&E stain slide image under microscope is shown in Figure 1. Base on
the H&E stain slide images, a domain expert gave ordinal scores: high,
medium or low to %deteriorating cells, %dead cells, %polygonal cells, %deformed
cells, cells eccentricity and %white area, which are considered as features;
and ordinal scores: good, fair or poor to health condition indicator, which is
considered as label. In addition, based on domain knowledge, %white area is
considered as independent to the other five features. The project tries to train
and find a proper classifier based on training dataset using Bayesian network approaches
so that new observations can be classified correctly based on corresponding features.
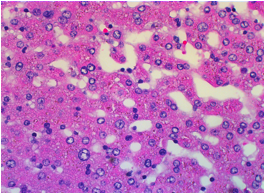
Figure 1. An
example of H&E stain slide image under microscope
Approaches
NB,
TAN and FAN are used for classification. NB assumes that the features are
conditional independent. TAN assumes that the features are not conditional
independent, but form a tree structure. FAN further assumes that the features
form a forest structure. The graph structures of NB, TAN and FAN are shown in
Figure 2. The above three approaches are used for solving the classification problem.
As based on domain knowledge, %white area is independent of the other five features,
thus, in FAN, %white area is set as a feature that is conditional independent
of the other features. 10-fold cross validation is used to obtain the
correctness of each of the three approaches.
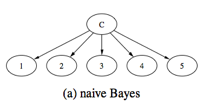
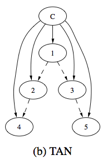
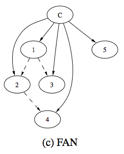
Figure 2. Graph structures
of NB, TAN and FAN
(Cited: Vikas Hamine and Paul Helman, A Theoretical and
Experimental Evaluation of Augmented Bayesian Classifiers.)
Results
The results of
the classification using 10-fold cross validation are given by confusion
matrices. As shown in Table 1, the correctness of the three approaches is all
high and close, and NB has the highest correctness.
Table 1. Confusion matrices for NB, TAN
and FAN
|
NB (78%) |
|
TAN (74%) |
|
FAN (73%) |
|||||||||
|
|
Fair |
Good |
Poor |
|
Fair |
Good |
Poor |
Fair |
Good |
Poor |
|||
|
Fair |
19 |
7 |
7 |
Fair |
15 |
9 |
9 |
Fair |
15 |
9 |
9 |
||
|
Good |
2 |
27 |
0 |
Good |
3 |
26 |
0 |
Good |
3 |
26 |
0 |
||
|
Poor |
3 |
3 |
32 |
Poor |
5 |
0 |
33 |
Poor |
6 |
0 |
32 |
||
In biomedical
area, it is not the same cost (or penalty) when we make false positive and
false negative errors. For example, it is much more harmful when we classify a
poor liver to be a good one, than a good liver to be a poor one for
transplantation purposes. Thus, a penalty is given to each type of classification
error, as shown in the penalty matrix in Table 2. The penalty values of each of
the three approaches are then shown in Table 3. The penalty values of the three
approaches are still close, but TAN and FAN are better than NB now.
Table 2. Penalty matrix
|
Penalty |
Fair |
Good |
Poor |
|
Fair |
0 |
5 |
1 |
|
Good |
1 |
0 |
1 |
|
Poor |
5 |
10 |
0 |
Table 3. Penalty values for NB, TAN and
FAN
|
Approach |
Penalty Value |
|
NB |
89 |
|
TAN |
82 |
|
FAN |
87 |
© Tingting Huang