Inferring Object Position with IR Sensors
Daniel FriedmanSpring 2014 ECE 6504 Probabilistic Graphical Models: Class Project
Virginia Tech
Goal
The goal of this project is to use the simplify the complexity of sensor configuration on a rover.For my ECE design capstone, ECE 4534: Embedded Systems, we were required to design and build a autonomous rover that could traverse, map, and then perform an optimized run on a maze. After deciding to use IR sensors, we concluded that the more points of data for a given sensor scan, the better. Given that all obstacles were either walls or cuboid chicanes, we decided to position an array of 5 IR sensors on a mount that would be pivoted by a servo, permitting a huge number of data points when the scans were interlaced.
Given the additional power consumption of a servo and complexity of driving it, the question arose as to whether or not, given the simplifying assumption of maze building blocks, the desired extra points of data could be inferred by a computationally simple model.
Approach
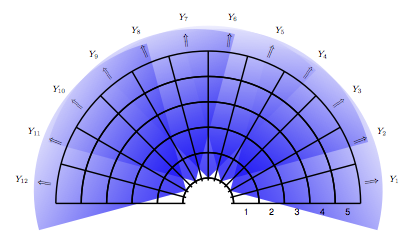
The main figure shows overlap of 5 wide-angle IR sensors. Their ranges have been partitioned into 1-5, and 6 (nothing in range). In this figure we see 12 prediction labels, but in the final we actually used 30.I first collected a data set of over 200 different wall configurations using 5 mounted IR sensors and scanning using a servo, this may be seen in the following clip:
The rover performed an ADC read of each IR sensor 10 times in each servo step, and then taking the median value. A piecewise quadratic function was then used to calculate distance from the non-linear IR readings. This was all done with the intention of reducing error and producing classifications that corresponded to discretized distances of equal unit lengths.
Given that the rover used PIC18F45J10 microcontrollers with onboard RAM of 1K, I decided that training would be performed on a computer and all results would be stored on external flash memory. This look-up table would need 30*6^5 bytes, which would easily fit on a 1 MB EEPROM chip.
Both Naive-Bayes (NB) and Tree-Augmented Naive-Bayes (TAN) were used to predict each of the 30 outputs for a 5 sensor read. The behaviour of a wide-angle IR sensor was approximated by taking th e minimum value within a subset of the 30 data points.
Results
The 10 fold cross validation error for NB and TAN were 43.1% and 32.4% respectively. This error stayed fairly consistent and did not increase, even when considering only half of the data set.Analysis
Though the error is not ideal, considering that error by random guess is around 83%, this is not terrible. Additionally, it serves its purpose quite well: After the rover has mapped the course, it uses a moving window center of mass calculation to smooth erraneous data points. At a 32% error, this doesn't perform too terribly.It is also worth mentioning that the 30 data point scans are far from perfect data. The combination of servo power draw and ADC reads meant that quite a large percentage of "real" data values were completely wrong. I'd estimate the error in sensor reads was about 7%, or 2 in every 30 points, which was despite the multiple measures taken in an attempt to ensure good values, e.g., median across 10 reads for each point of data.
Ultimately, the mapping produced by the IR sensors inferring data (from generated look-up table) was very similar to that of the servo scanning rover. The time and energy saved was quite noticeable, allowing extra time to be spent post-processing the map.