Milestone 3
| Assigned: | 10/25 |
| Due: | Wednesday 11/14 by 11:59 pm |
Updates
- Thu Nov 8 08:40:56 EST 2018: to clarify the layout specification, revealed test for testDiscretePlotLayout
Introduction
In this milestone you will so some minor improvements to graphics rendering and develop the plotting functionality that gives PlotScript it's name.
You should complete milestone 0 through 2 before attempting this one.
Background Information
Task 1: Graphics continued
- Modify your code handling Text graphics from milestone 2 as follows:
- Modify the position of Text graphics to be at the center of it's bounding box and to use the "Courier" font with a point size of one. Thus, when the position is specified in PlotScript it should be the center of the text bounding box in the QtGraphicsScene coordinate system. For example the following code
(make-text "Hello World!")renders as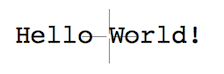
- Add an optional "text-scale" property mapping to a positive Number indicating the scale factor to use when displaying the text. If not present or the property value is invalid, the default scale factor is one.
- Add an optional "text-rotation" property mapping to a Number specifying the rotation angle about the Text Position in radians. If not present or the property value is invalid, the default rotation is zero.
- Modify the behavior of OutputWidget so that the view never uses scroll-bars but all graphics are visible, even after re-sizing the window.
Task 2: Discrete Plots
Discrete plots take a list of lists with two Number entries, denoting the abscissa (horizontal) and ordinate (vertical) coordinates respectively of points, producing a PlotScript List of Graphic objects rendering a stem plot (also called a lollipop plot) of the data (see details below). The procedure call is of the form:
(discrete-plot DATA OPTIONS)where DATA is the list of coordinates described above (note, they are not required to have the "point" object-name), and OPTIONS is a List of Lists, each entry being a String Expression followed by an arbitrary Expression, specifying one of the following plotting options:
- "title" followed by a String representing the title text of the plot,
- "abscissa-label", followed by a String representing the text of the abscissa (horizontal, x) label,
- "ordinate-label", followed by a String representing the text of the ordinate (vertical, y) label,
- "text-scale", positive Number representing the scale factor to apply to all text in the plot, defaults to 1.
The procedure should return a List of Lines, Points, and Text that constitute the plot.
The graphical layout of the discrete plot defined by a nested set of rectangles (see figure below). The innermost rectangle is defined by the bounding-box of the plot data. The next rectangle moving outward is defined by an offset from the data bounding box (dimensions C and D) and is used to place the abscissa and ordinate tick labels (AL, AU, OL, and OU). The outermost rectangle is defined by an offset from the data bounding-box rectangle (dimensions A and B) and is used to place the title and axis labels.
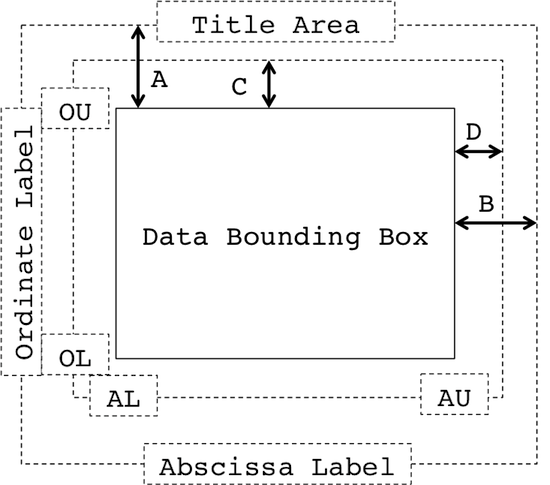
- The Title Area is centered on the northern border of the outer rectangle.
- The Abscissa Label is centered on the southern border of the outer rectangle.
- The Ordinate Label is centered on the western border of the outer rectangle.
- The tick labels corresponding to the bounds of the data (AL, AU, OL, OU) should be replaced with their numerical values using a floating point precision of 2, and be centered on the corners of the bounding-box and the intermediate rectangle defined by the offsets C and D.
The bounding box of the data is given by the minimum and maximum of the abscissa and ordinate values respectively, scaled to a rectangle of size NxN. All PlotScript graphic objects pertaining to data (as opposed to annotations) should be scaled to fit in this rectangle.
The bounding-box should be drawn using a thickness of zero ( a cosmetic line in Qt). The coordinate system is such that the positive abscissa axis is oriented to screen right, and the positive ordinate axis is oriented to screen up. For each data point a cosmetic line should be drawn from the abscissa value, zero to the abscissa value, ordinate value, and a point of size P centered at its end drawn. If the bounding box include the zero abscissa or ordinate axis they should be drawn, again using a cosmetic line.
The layout parameters above should be easily changed with defined constants and have the following values:
- N = 20
- A = 3
- B = 3
- C = 2
- D = 2
- P = 0.5
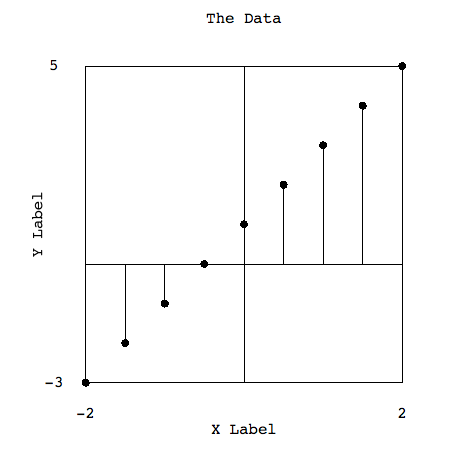
Example: the following plots a linear discrete function,
; plot the linear function y = f[x] = 2x+1 for x in [-2, -1.5, -1, ..., 2]
(begin
    (define f (lambda (x)
        (list x (+ (* 2 x) 1))))
    (discrete-plot (map f (range -2 2 0.5))
       (list
       (list "title" "The Data")
       (list "abscissa-label" "X Label")
       (list "ordinate-label" "Y Label")
       (list "text-scale" 1))))
producing a List of Lines, Points, and Text that when displayed in the Notebook look like the following:
In order to clarify the specification above here are the contents testDiscretePlotLayout:
void NotebookTest::testDiscretePlotLayout() {

  std::string program = R"(
(discrete-plot (list (list -1 -1) (list 1 1))
    (list (list "title" "The Title")
          (list "abscissa-label" "X Label")
          (list "ordinate-label" "Y Label") ))
)";

  inputWidget->setPlainText(QString::fromStdString(program));
  QTest::keyClick(inputWidget, Qt::Key_Return, Qt::ShiftModifier);

  auto view = outputWidget->findChild<QGraphicsView *>();
  QVERIFY2(view, "Could not find QGraphicsView as child of OutputWidget");

  auto scene = view->scene();

  // first check total number of items
  // 8 lines + 2 points + 7 text = 17
  auto items = scene->items();
  QCOMPARE(items.size(), 17);

  // make them all selectable
  foreach(auto item, items){
    item->setFlag(QGraphicsItem::ItemIsSelectable);
  }

  double scalex = 20.0/2.0;
  double scaley = 20.0/2.0;

  double xmin = scalex*-1;
  double xmax = scalex*1;
  double ymin = scaley*-1;
  double ymax = scaley*1;
  double xmiddle = (xmax+xmin)/2;
  double ymiddle = (ymax+ymin)/2;

  // check title
  QCOMPARE(findText(scene, QPointF(xmiddle, -(ymax+3)), 0, QString("The Title")), 1);

  // check abscissa label
  QCOMPARE(findText(scene, QPointF(xmiddle, -(ymin-3)), 0, QString("X Label")), 1);

  // check ordinate label
  QCOMPARE(findText(scene, QPointF(xmin-3, -ymiddle), -90, QString("Y Label")), 1);

  // check abscissa min label
  QCOMPARE(findText(scene, QPointF(xmin, -(ymin-2)), 0, QString("-1")), 1);

  // check abscissa max label
  QCOMPARE(findText(scene, QPointF(xmax, -(ymin-2)), 0, QString("1")), 1);

  // check ordinate min label
  QCOMPARE(findText(scene, QPointF(xmin-2, -ymin), 0, QString("-1")), 1);

  // check ordinate max label
  QCOMPARE(findText(scene, QPointF(xmin-2, -ymax), 0, QString("1")), 1);

  // check the bounding box bottom
  QCOMPARE(findLines(scene, QRectF(xmin, -ymin, 20, 0), 0.1), 1);

  // check the bounding box top
  QCOMPARE(findLines(scene, QRectF(xmin, -ymax, 20, 0), 0.1), 1);

  // check the bounding box left and (-1, -1) stem
  QCOMPARE(findLines(scene, QRectF(xmin, -ymax, 0, 20), 0.1), 2);

  // check the bounding box right and (1, 1) stem
  QCOMPARE(findLines(scene, QRectF(xmax, -ymax, 0, 20), 0.1), 2);

  // check the abscissa axis
  QCOMPARE(findLines(scene, QRectF(xmin, 0, 20, 0), 0.1), 1);

  // check the ordinate axis
  QCOMPARE(findLines(scene, QRectF(0, -ymax, 0, 20), 0.1), 1);

  // check the point at (-1,-1)
  QCOMPARE(findPoints(scene, QPointF(-10, 10), 0.6), 1);

  // check the point at (1,1)
  QCOMPARE(findPoints(scene, QPointF(10, -10), 0.6), 1);
}
where the helper functions are defined as:
/*
findLines - find lines in a scene contained within a bounding box
            with a small margin
 */
int findLines(QGraphicsScene * scene, QRectF bbox, qreal margin){

  QPainterPath selectPath;

  QMarginsF margins(margin, margin, margin, margin);
  selectPath.addRect(bbox.marginsAdded(margins));
  scene->setSelectionArea(selectPath, Qt::ContainsItemShape);

  int numlines(0);
  foreach(auto item, scene->selectedItems()){
    if(item->type() == QGraphicsLineItem::Type){
      numlines += 1;
    }
  }

  return numlines;
}

/*
findPoints - find points in a scene contained within a specified rectangle
 */
int findPoints(QGraphicsScene * scene, QPointF center, qreal radius){

  QPainterPath selectPath;
  selectPath.addRect(QRectF(center.x()-radius, center.y()-radius, 2*radius, 2*radius));
  scene->setSelectionArea(selectPath, Qt::ContainsItemShape);

  int numpoints(0);
  foreach(auto item, scene->selectedItems()){
    if(item->type() == QGraphicsEllipseItem::Type){
      numpoints += 1;
    }
  }

  return numpoints;
}

/*
findText - find text in a scene centered at a specified point with a given
           rotation and string contents
 */
int findText(QGraphicsScene * scene, QPointF center, qreal rotation, QString contents){

  int numtext(0);
  foreach(auto item, scene->items(center)){
    if(item->type() == QGraphicsTextItem::Type){
      QGraphicsTextItem * text = static_cast<QGraphicsTextItem *>(item);
      if((text->toPlainText() == contents) &&
     (text->rotation() == rotation) &&
     (text->pos() + text->boundingRect().center() == center)){
    numtext += 1;
      }
    }
  }

  return numtext;
}

/*
intersectsLine - find lines in a scene that intersect a specified rectangle
 */
int intersectsLine(QGraphicsScene * scene, QPointF center, qreal radius){

  QPainterPath selectPath;
  selectPath.addRect(QRectF(center.x()-radius, center.y()-radius, 2*radius, 2*radius));
  scene->setSelectionArea(selectPath, Qt::IntersectsItemShape);

  int numlines(0);
  foreach(auto item, scene->selectedItems()){
    if(item->type() == QGraphicsLineItem::Type){
      numlines += 1;
    }
  }

  return numlines;
}
Task 3: Continuous Plots
Continuous plots take a lambda function of a single independent variable and a List with two entries denoting the lower and upper bounds of the independent variable, producing PlotScript graphic objects rendering a continuous plot of the function (see details below). The procedure call is of the form:
(continuous-plot FUNC BOUNDS OPTIONS)where FUNC is a PlotScript lambda function of a single variable, BOUNDS is a list of size two holding Numbers representing the lower and upper bound of the domain of the function (the abscissa), and OPTIONS is the same as for discrete plots.
The graphical layout of the continuous plot is the same as for the discrete plot, but the algorithm for drawing the plot differs, and is as follows. Start by sampling M = 50 equally spaced points between the lower and upper bounds of the abscissa, using the lambda function to determine the ordinate value, and connect the resulting coordinates by lines. Then for MAX = 10 number of iterations, if the angle between two adjacent lines is less than 175 degrees, split each line on either side by evaluating the lambda function at the midpoint of each line. Stop this process when no splits are made or the MAX number of iterations has been reached.
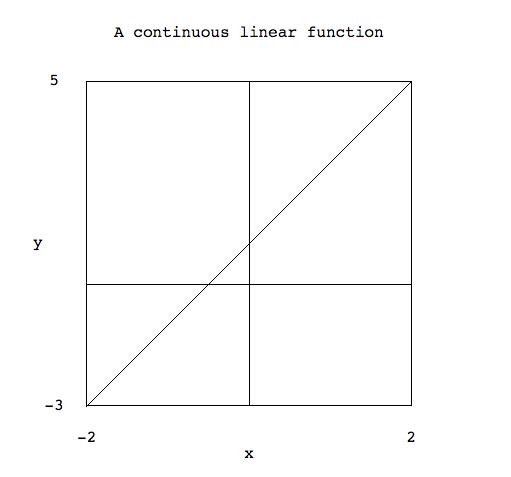
Example: The following plots the linear function f(x)=2x + 1 for x ∈ [ − 2, 2],
; plot the linear function f(x) = 2x+1 for x in [-2, 2]
(begin
    (define f (lambda (x)
        (+ (* 2 x) 1)))
    (continuous-plot f (list -2 2)
        (list
        (list "title" "A continuous linear function")
        (list "abscissa-label" "x")
        (list "ordinate-label" "y"))))
producing a List of Lines, Points, and Text that when displayed in the Notebook look like the following:
Additional Examples
Below is a video demonstrating the expected behavior of Milestone 3. Note the widgets on your host may appear slightly different. You can pause the video to see study specific input/output behavior.
Submission
To submit your milestone:
Tag the git commit that you wish to be considered for grading as "milestone3".
git tag milestone3Push this change to GitHub
git push origin milestone3
If you need to tag a different version of your code simply create and push a new tag appending a monotonically increasing number to milestone3 using '-', e.g. milestone3-2, milestone3-3, etc.
Be sure you have committed all the changes you intend to. You should re-clone your repository into a separate directory and double check it is what you intend to submit. Failure to complete these steps by the due date may result in a failed submission.
Grading
There are 6 course percentage points allocated to this milestone. You will receive a detailed feedback report on your submission via Canvas within two weeks of the due date.
| Code compiles in the reference environment | 0.5 points |
| Correctness Tests | 4 points |
| Testing | 0.5 points |
| Code Quality | 0.5 point |
| Good Development Practices | 0.5 point |
Grading Notes:
- If your code does not build in the reference environment you will receive no points.
- Correctness can be checked in the auto-grader and is determined by the proportion of instructor tests that pass.
- Testing includes both unit test coverage and completeness of NotebookApp functional tests. Unit test coverage can be determined in the reference environment using the same procedure in Milestone 1.
- Code quality means your code compiles with no warnings at a high-warning level (STRICT in the reference environment) and your unit tests have no memory leaks, as well as other criteria mentioned in class (function length, variable naming, etc).
- Good development practices is assessed by looking for regular, incremental, and well-packaged commits.